TinkerPlots Tutorial
Initially, I did not think I would appreciate this program. I started this project by just downloading the program off the Tinkerplot website and seeing what I could figure out without any help. It was much harder than I anticipated. I fiddled around with the program for about 20 minutes and then got frustrated and went onto the internet and searched for tutorials. I think that would be a good way for students to start. Allow them to start exploring on YouTube and listening to tutorials before opening the program.
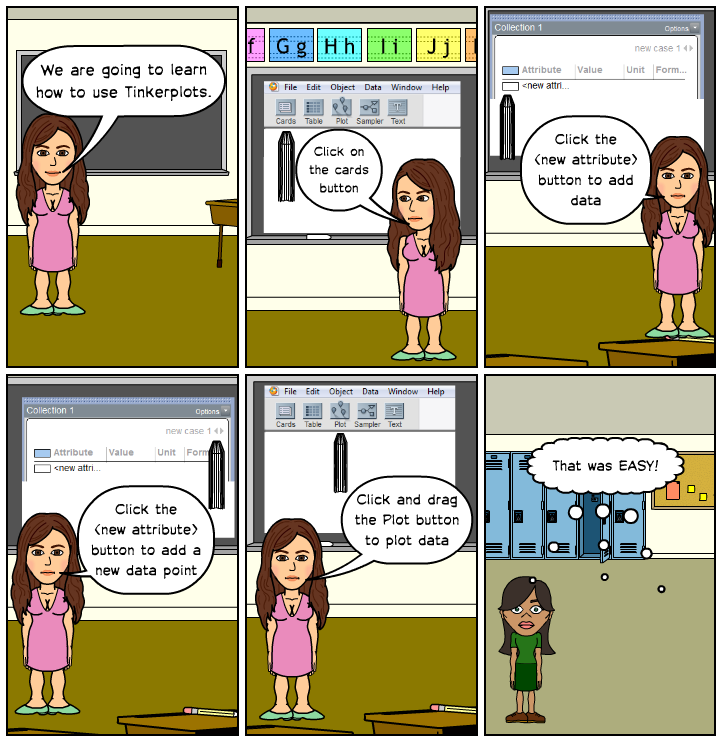
The idea of the program is to allow students to input data with multiple attributes per data point. TinkerPlots takes the data and graphs it using the a line graph. From there, students can change the type of graph and many other attributes of the graph to compare and analyze data.
After watching the tutorial I realized that the possibilities were endless with this program. I quickly got an understanding of the basics and then was able to explore the program without much more internet guidance. This approach would allow students to really explore data management and probability in a way that would be new and exciting for them. I would introduce students to this program by importing data and allowing them to fiddle with graphing, rather than overwhelming them with inputting data and graphing. There are lots of resources online that refer to the Ontario Curriculum to aid teachers in using the program effectively.
I am happy with the final product. I wanted to give my classmates a comprehensive guide for using the program, as well as an easy to comprehend Bitstrip. I would both took longer than I expected, but once I got the hang of how to put together a slide or panel, the rest was easy.
These tutorials helped me start learning how to use Tinkerplots. They give easy to follow step by step instructions.